Observe the process
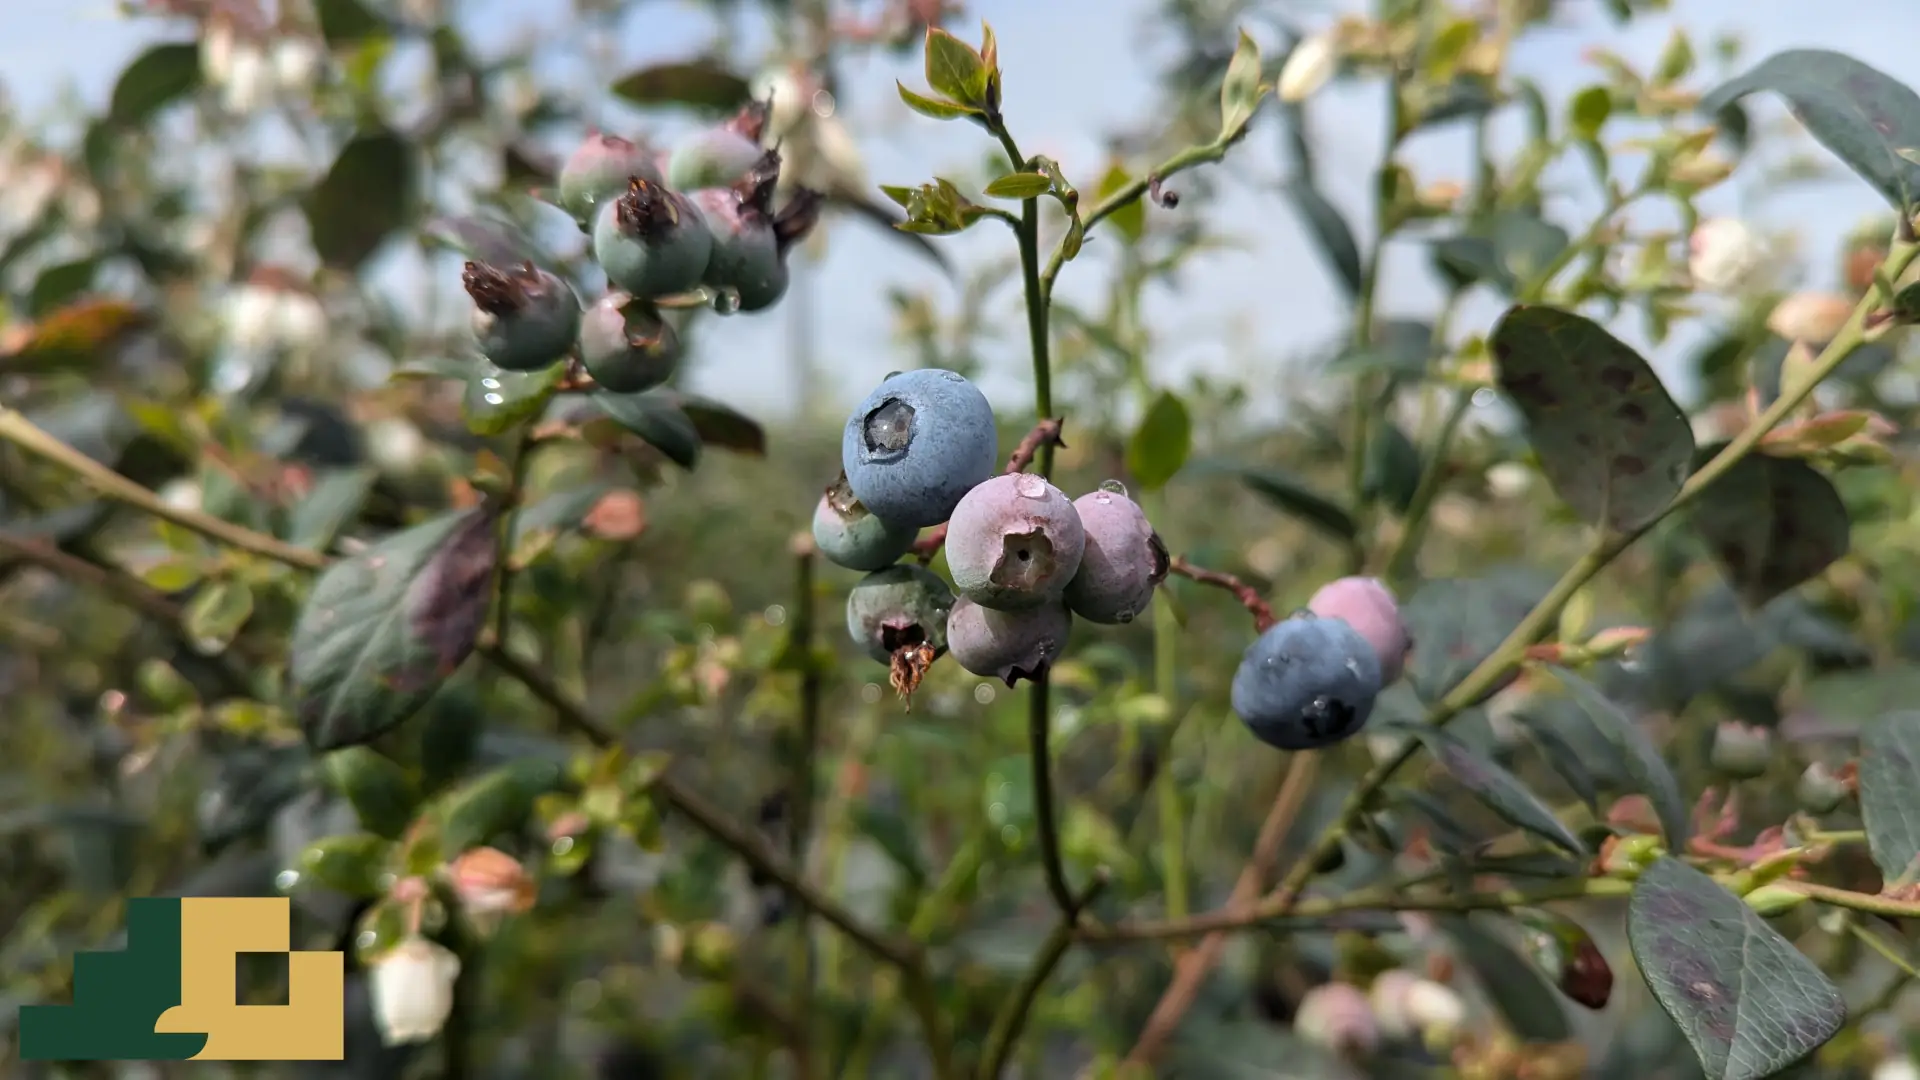
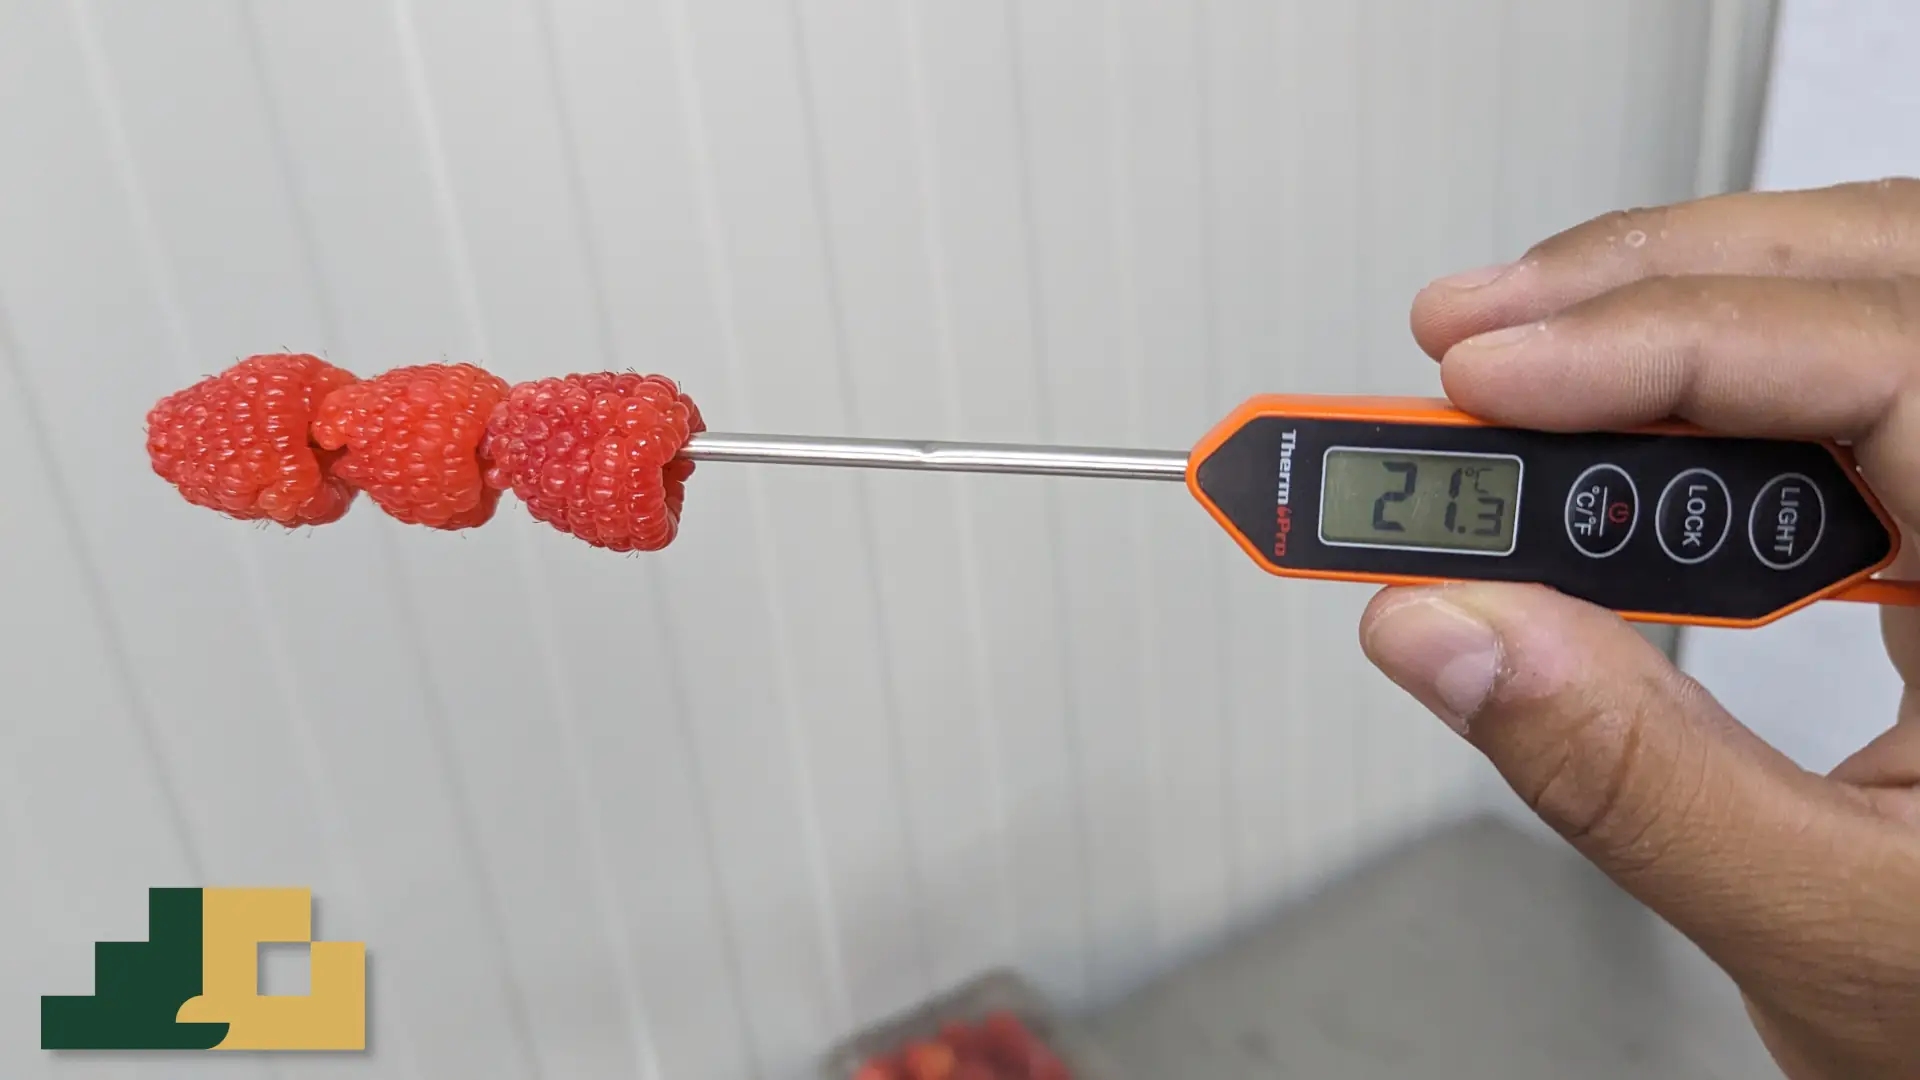
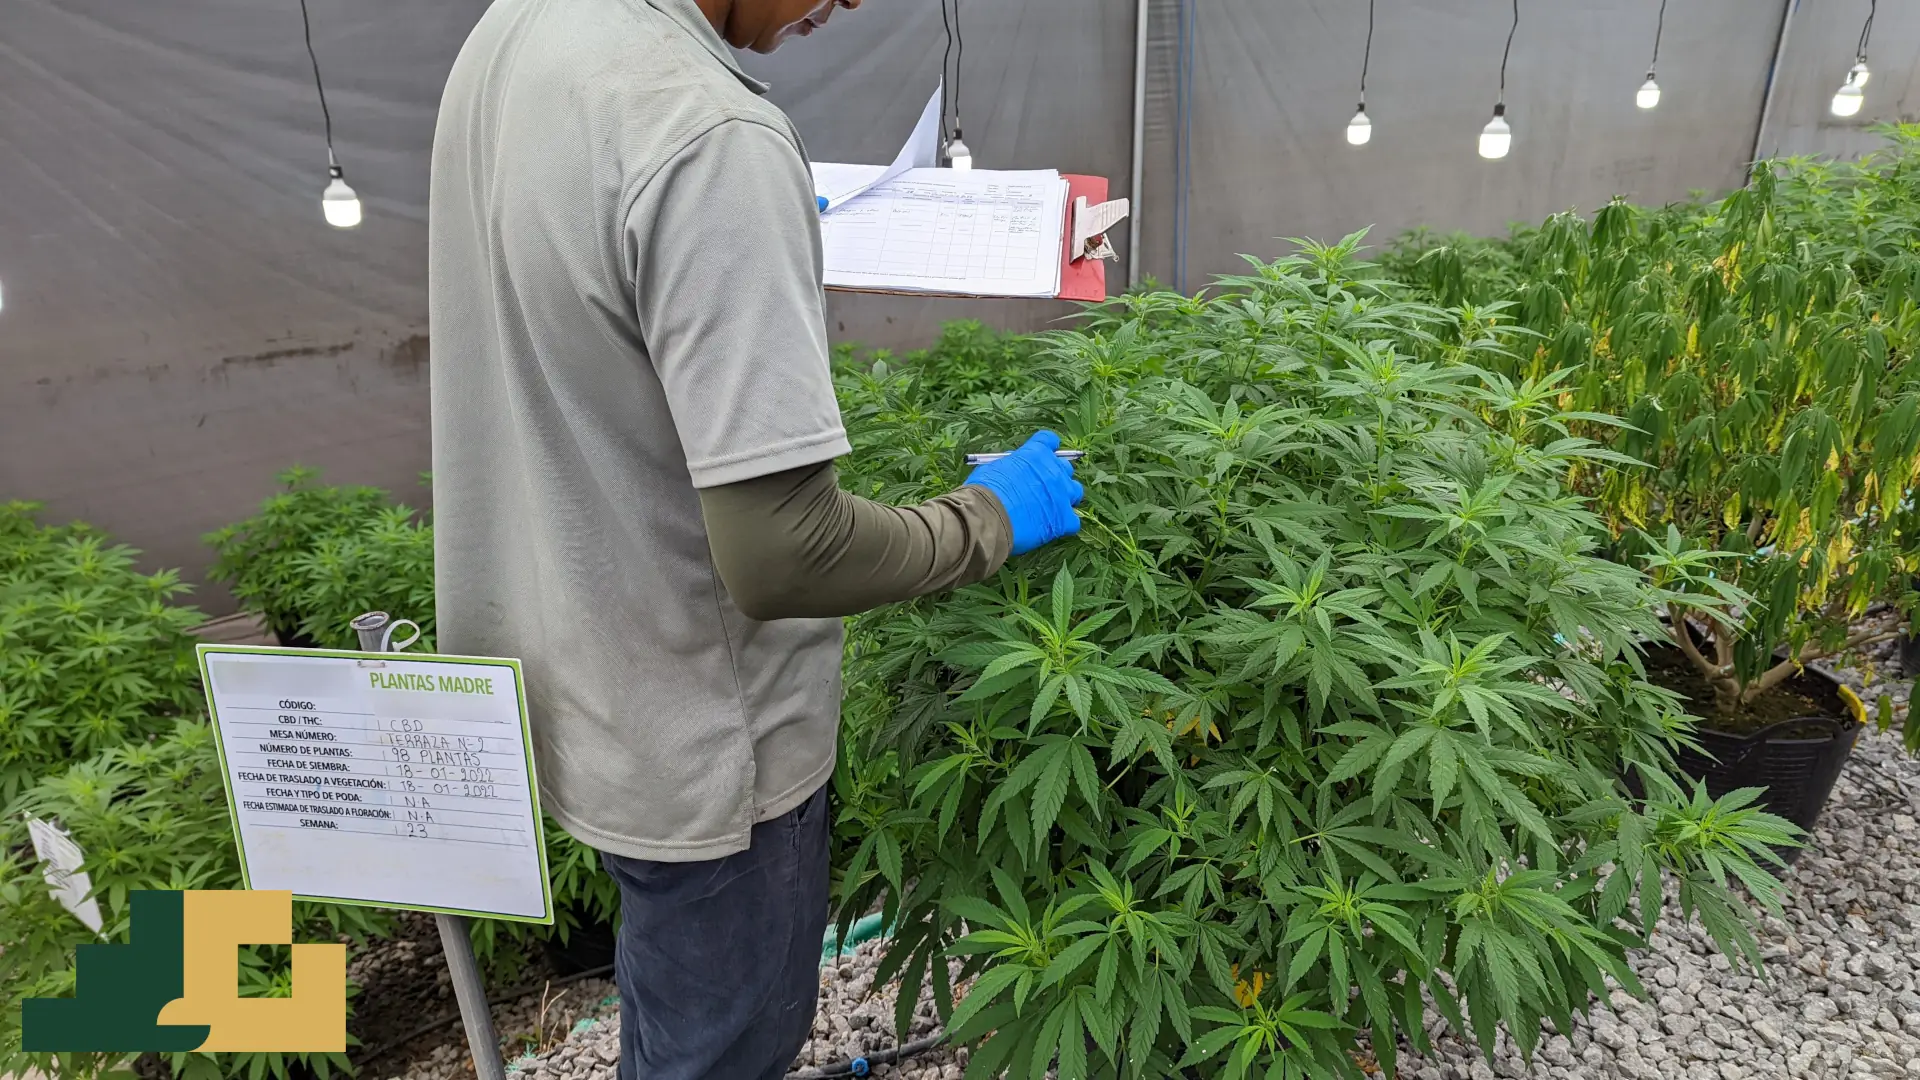
As an agroindustrial engineer, I break processes down into their minimum units and understand the biological, physical, and chemical challenges of raw materials. Operational context isn't a detail: it's half the diagnosis.

AGRODATA · AGROINDUSTRIAL DATA ANALYSIS
The challenge I solve
Agroindustry generates massive amounts of information: production, harvest, post-harvest, quality, logistics, sales. But it usually stays locked in spreadsheets and dead files, while decisions are made by gut feeling.
My solution
I turn that scattered information into visibility for decision-making. I don't deliver charts; I deliver clarity to act.
How I work
As an agroindustrial engineer, I break processes down into their minimum units and understand the biological, physical, and chemical challenges of raw materials. Operational context isn't a detail: it's half the diagnosis.
I clean historical records, connect variables no one had linked before, and segment. What averages hide appears when data is looked at properly.
Analysis doesn't end in a chart: it ends in an action someone can execute. I connect operations with sales.
Cases
Projects under confidentiality agreements, presented in anonymized form. Same pattern, same method: moving from intuition to decision.
From guessing to planning with data
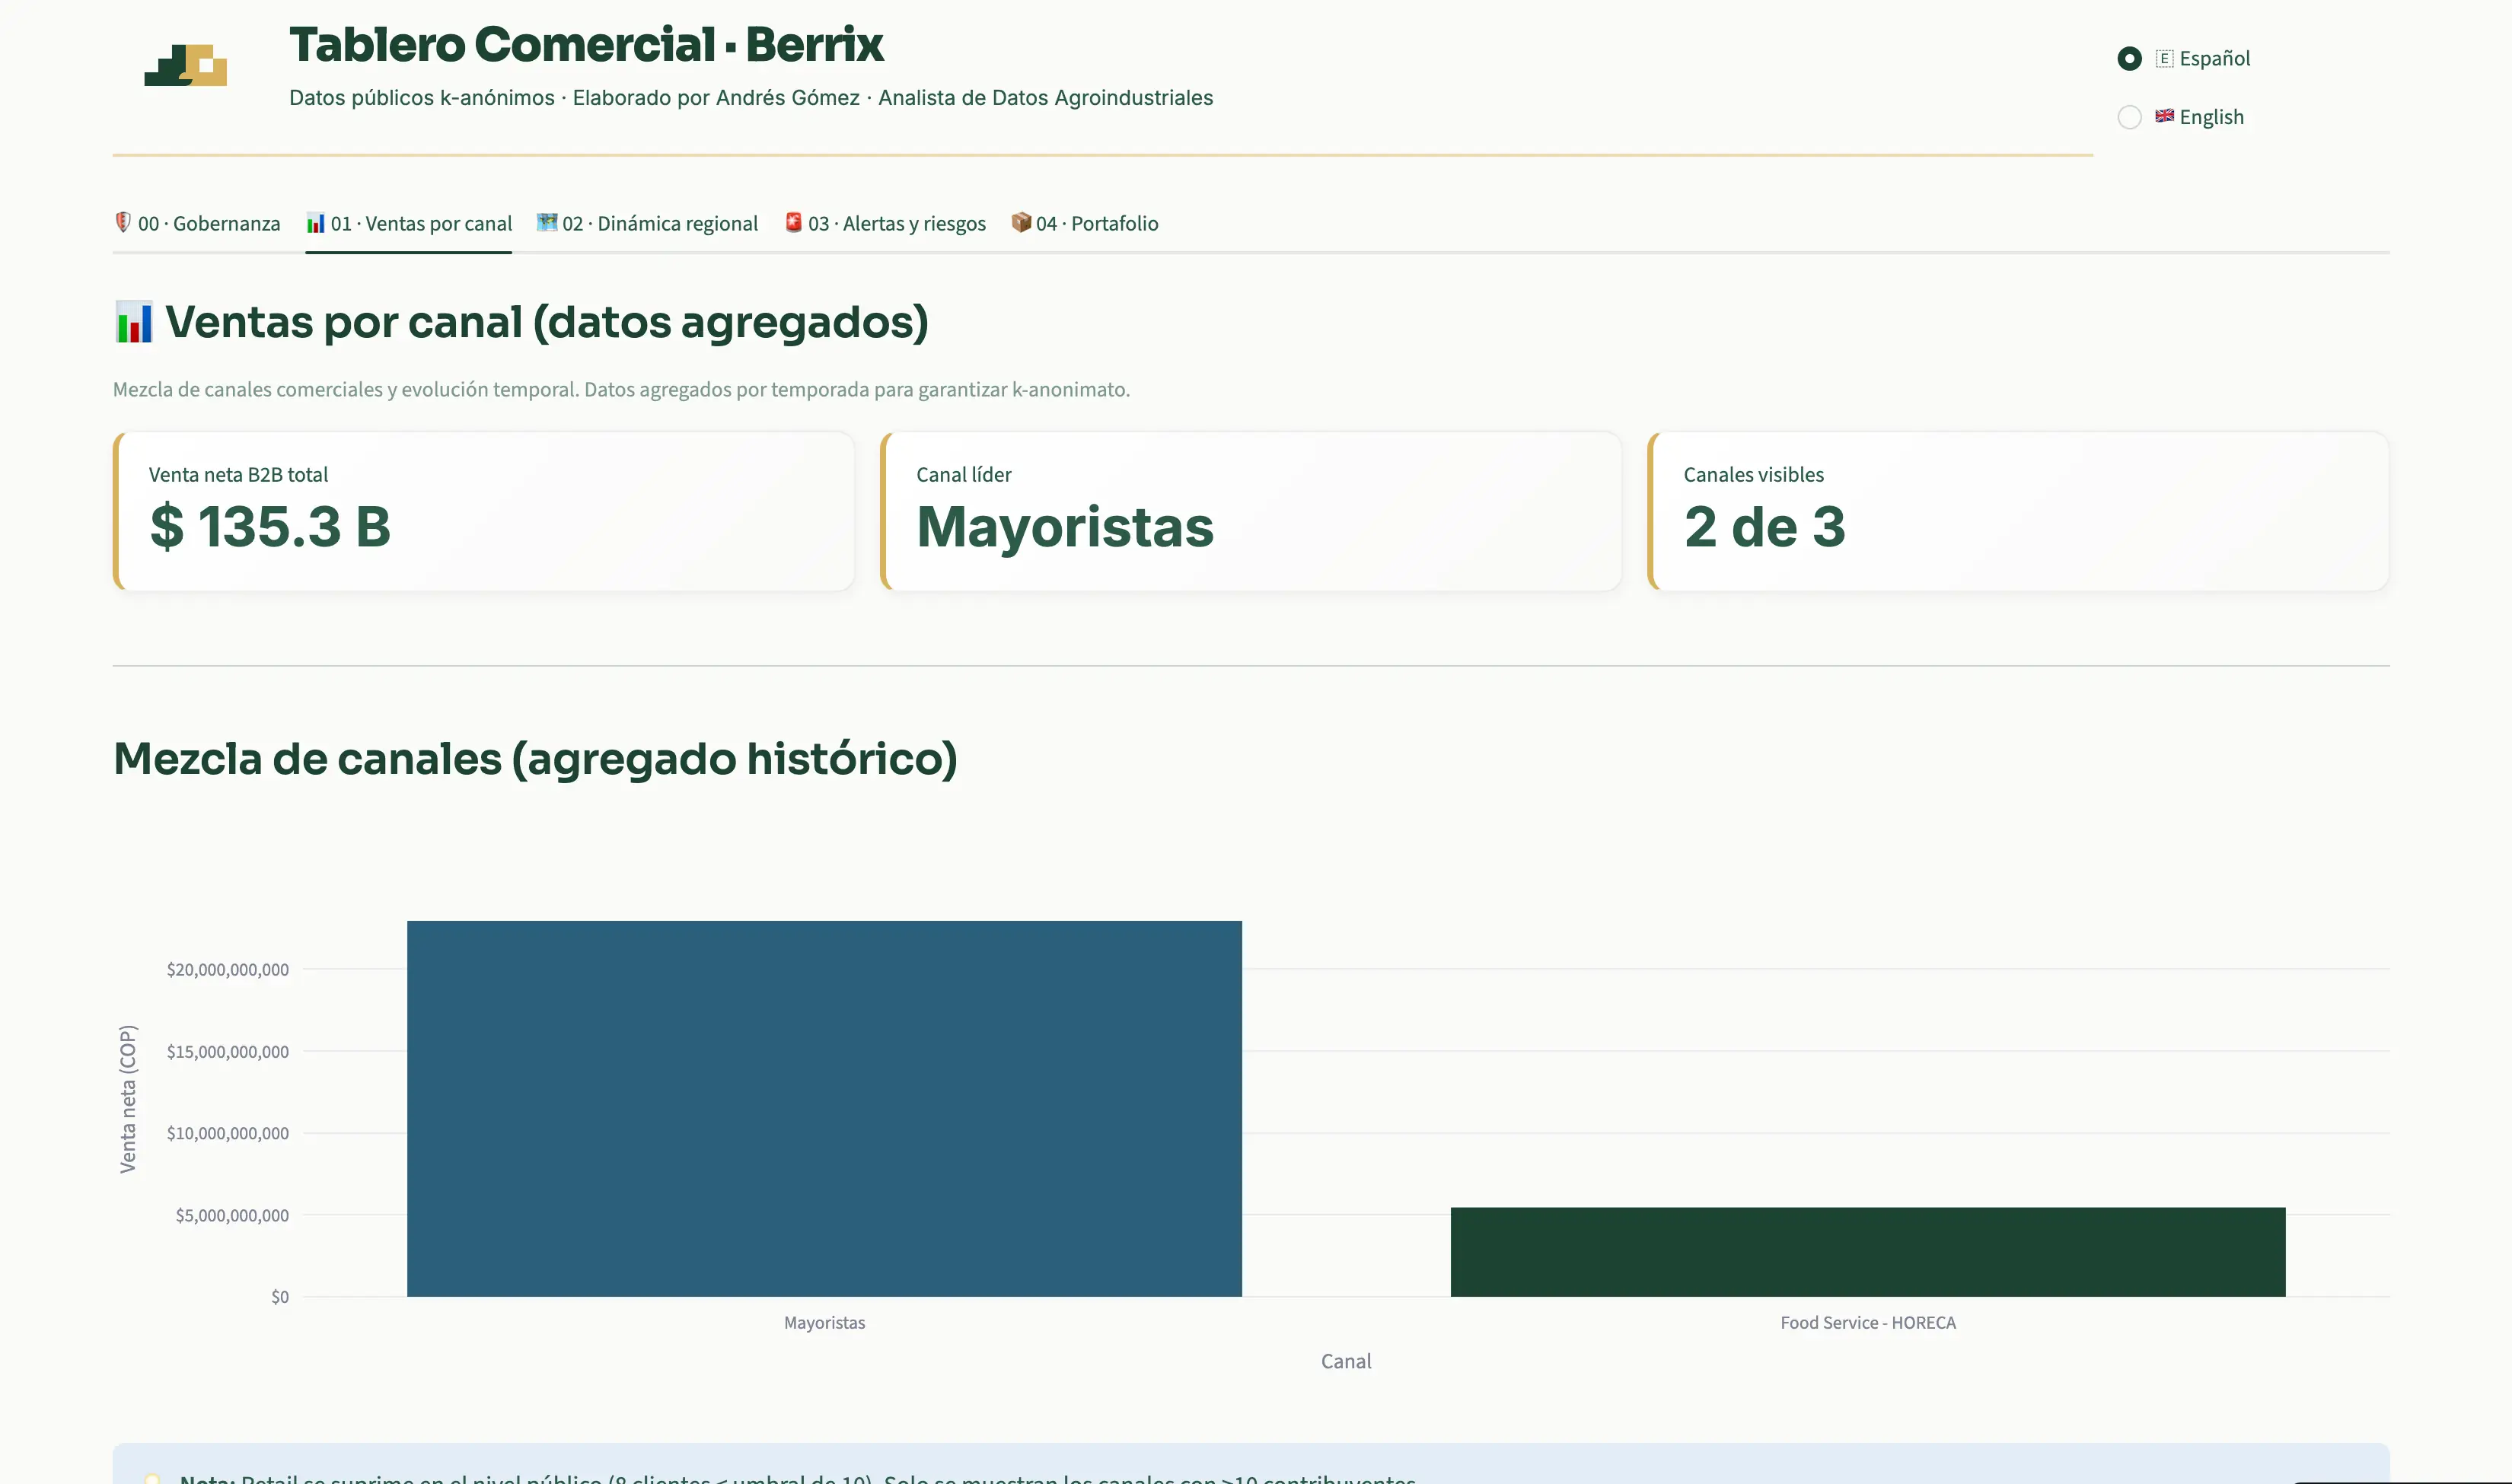
Fresh berries distributor, with B2B and B2C channels.
Decisions made by gut feeling; no visibility by channel, region, or customer.
Transformed five scattered datasets into a control dashboard: sales, regional dynamics, risk alerts, and portfolio.
A commercial team that went from reactive to planning, with risk traffic lights and dependency matrices.
From static averages to a prescriptive harvest plan
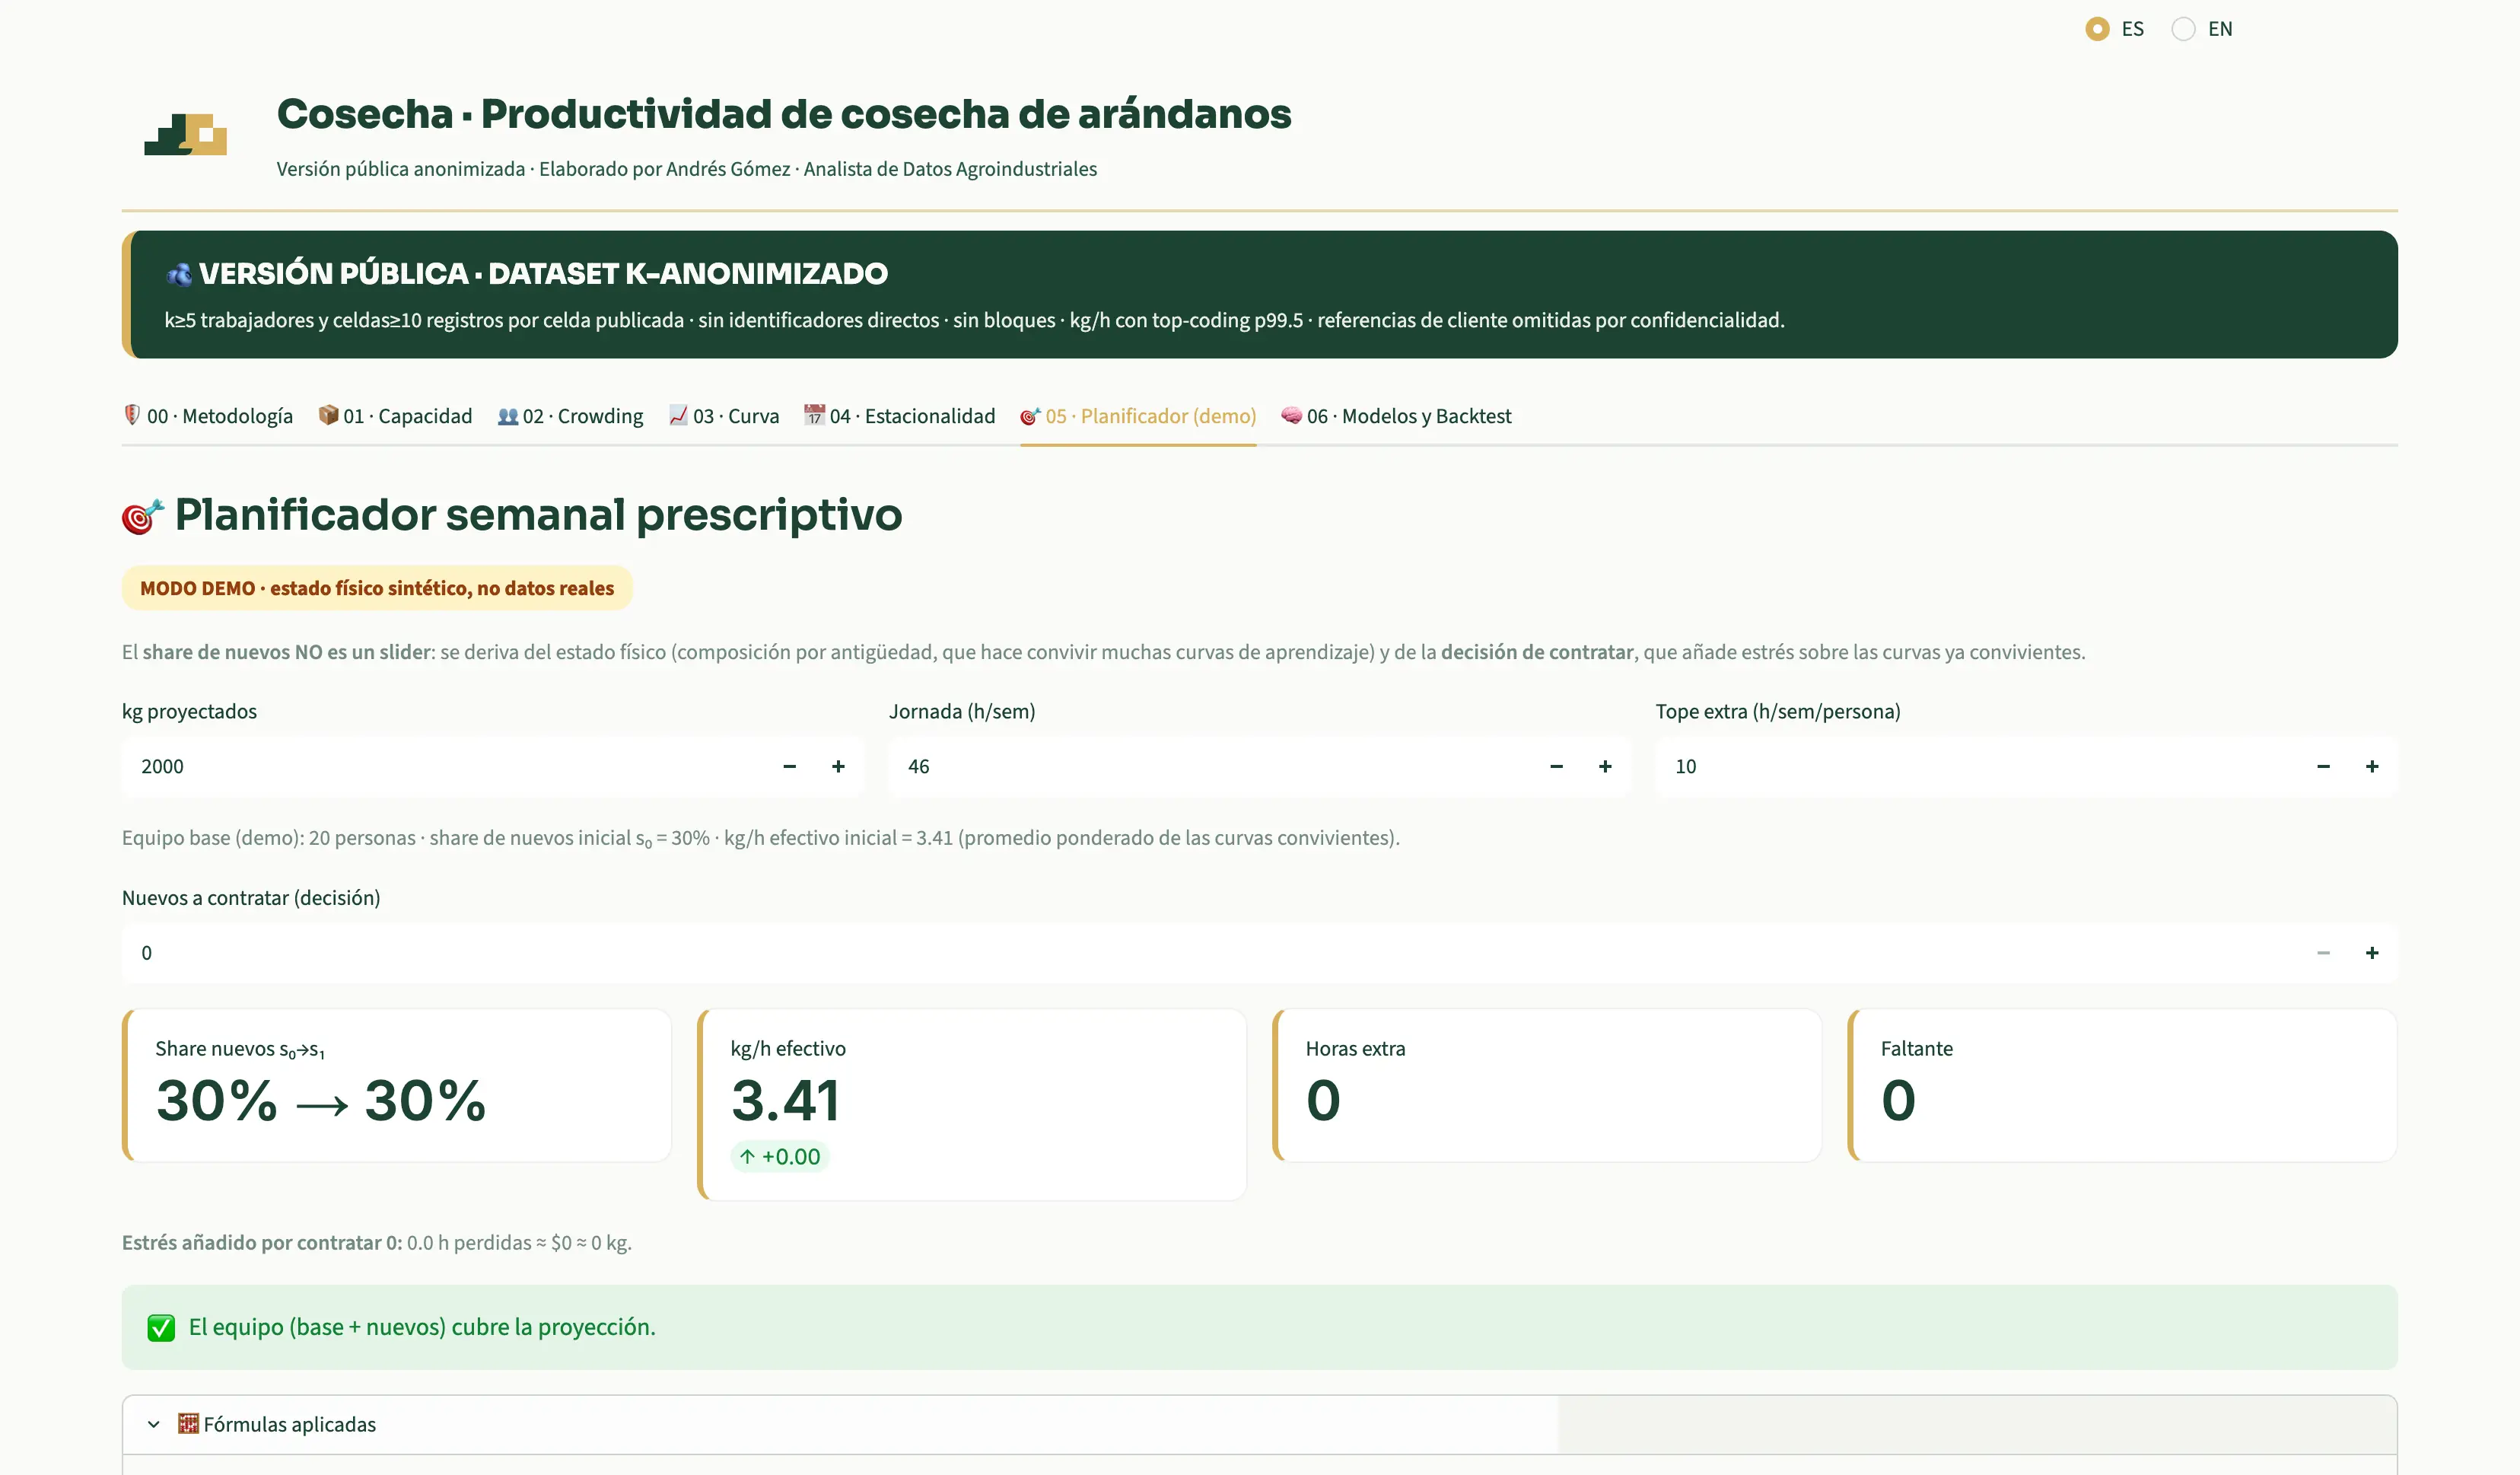
Blueberry agroindustry with guesswork planning, surprise overtime, and bullwhip effect.
How to turn historical records into a weekly plan for hours, gaps, and costs with uncertainty visible?
Averages hid a vicious cycle: learning curve impact, fatigue, seasonality, and labor competition.
A zoo of forecasts for a prescriptive model: hire when break-even justifies it, recalibrate targets in stress windows.
What hurts the most, in one number
Colombian rose exporter.
Operations depend on the dollar, wages, waste, price, and freight. Every movement changes the margin, with no tool to quantify it.
Sensitivity model translating each variable's movement into pesos of profit lost or gained. Tornado diagram to prioritize management levers.
Each sensitivity points to a different lever. The model quantifies exposure; the client makes the decision.
Toolkit
I don't choose the tool because it's trendy. I choose the one that reduces friction between raw data and Wednesday's 9 a.m. decision.
I walk the production process stage by stage —times, waste, labor, bottlenecks— to draw where value is lost before proposing anything.
I translate dollar, wage, waste, and freight movements into pesos of profit lost or gained. Tornado diagrams to decide with numbers.
I unify scattered datasets into interactive dashboards showing channel, region, customer, and risk in a single view. Designed for committees, not just monitors.
I clean historicals and segment workers, varieties, and customers to find what averages hide. Explainable solutions without black boxes.
Journey
I didn't reach data from a desk. I came from the field, first understanding biological and operational processes, then measuring them with rigor.
The technical base. I learned to break processes into minimum units and understand the biological, physical, and chemical challenges of raw materials.
Direct experience in mushrooms, cannabis, and berries. Here I learned that averages lie and that labor is the most critical bottleneck.
The natural evolution. I incorporated Python, SQL, and other tools. I moved from reporting what happened to building explainable predictive models.
Today I translate that duality. I speak the language of the field and the language of data, building bridges between both to decide with clarity.
Free Resource
Download our quick guide and audit your data maturity in 10 minutes. Identify the 5 most common mistakes in agroindustry and how to fix them.
Download Checklist (PDF)Contact
If your project or company has operational or commercial information that isn't being used to decide, write to me. We review the context, evaluate feasibility, and I tell you clearly what can be done.
Location: Colombia (Available for remote projects)
Response: Within 48 business hours.